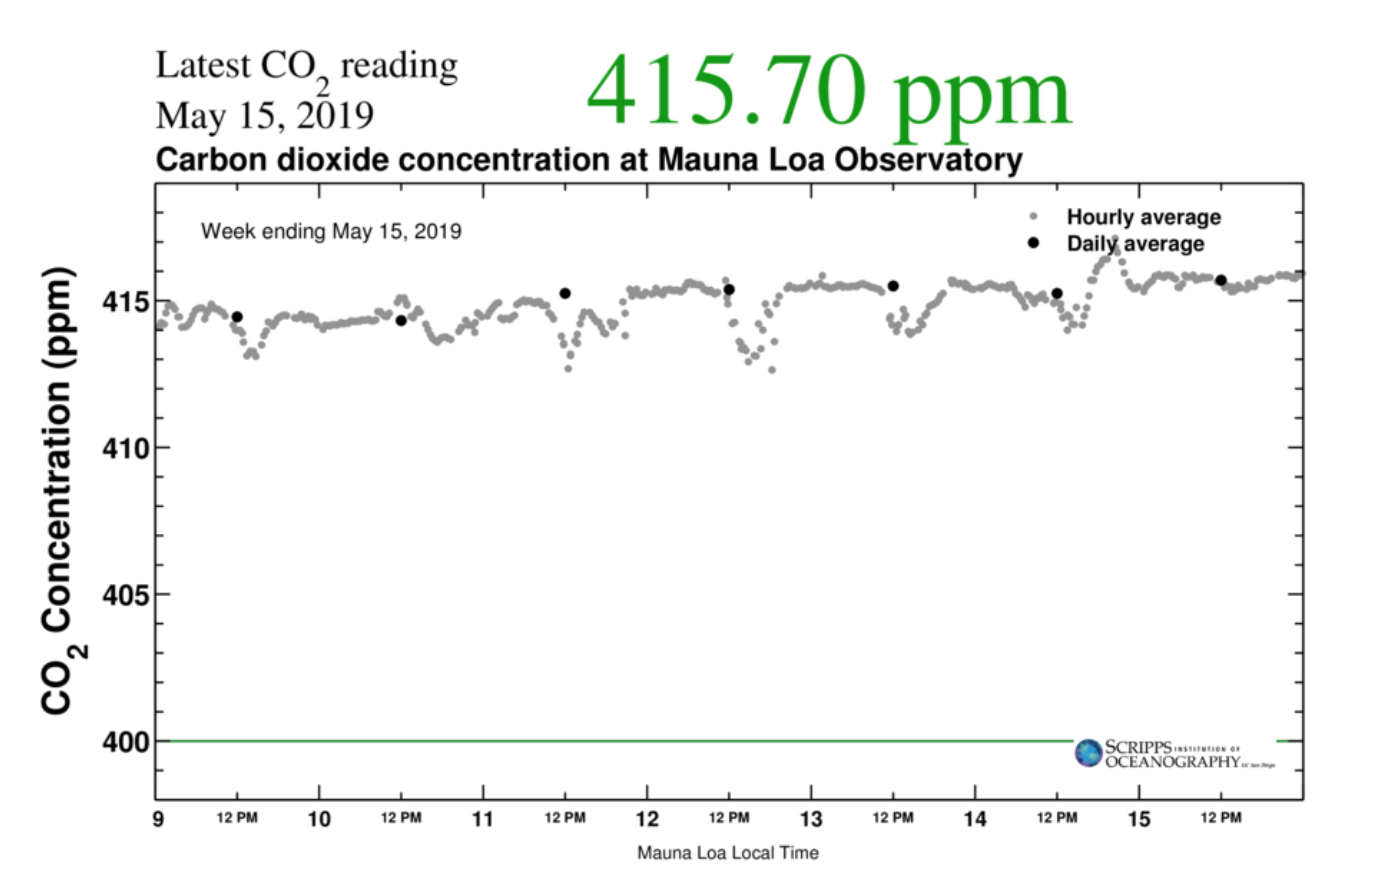
Climate change -- it’s big, it’s scary, and it’s now. The phrase “climate change” has become more of a trigger word lately, and frankly, one that most people are desensitized to. In May 2019, the Scripps Institution of Oceanography reported that for the first time in human history, our planet’s atmosphere reached a daily baseline of atmospheric CO2 levels above 415 ppm (Figure 1). Climate scientist Peter Gleick said that humans didn’t even exist the last time our planet reached atmospheric CO2 levels like these (Figure 2).
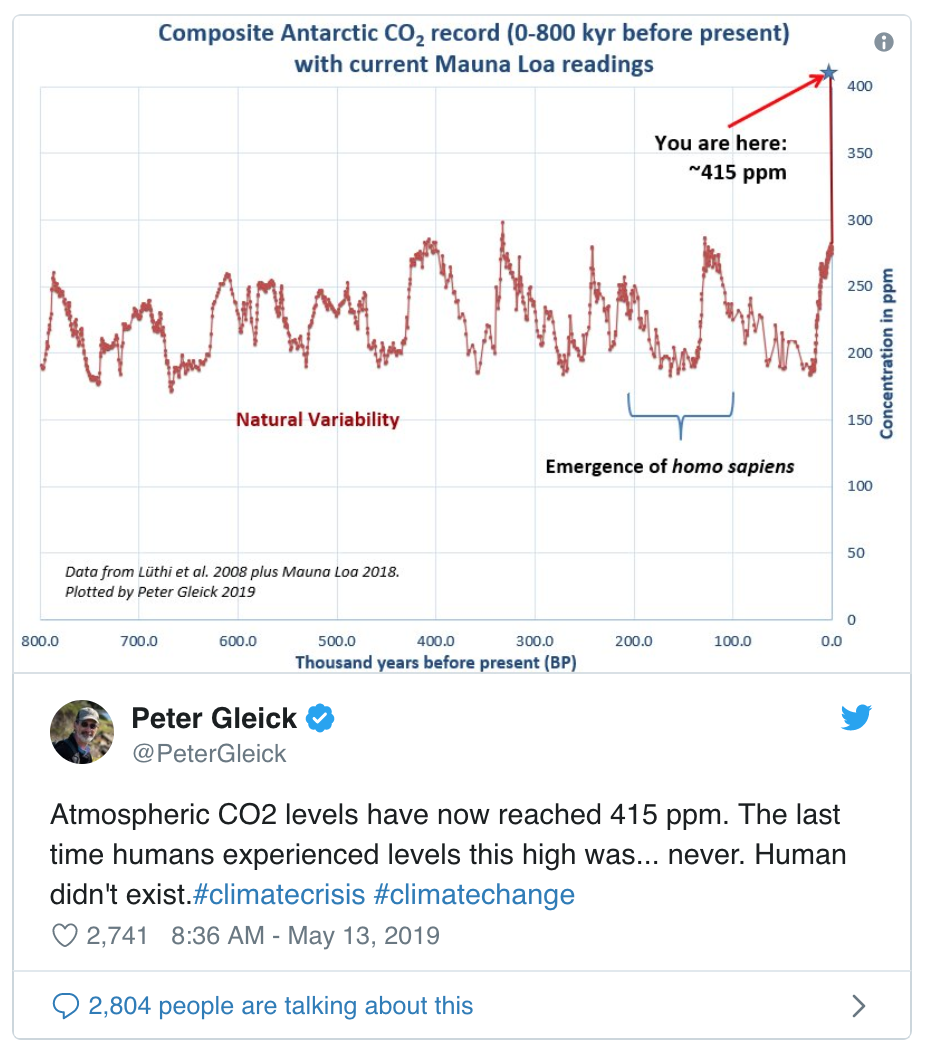
Figure 2: Peter Gleick's Twitter post about
The long term trend in global atmospheric CO2 concentration variation is evident from over 50 years of investigation using many sources of information. Hypothetically, if fossil fuel emissions and deforestation never happened, we would still see a seasonal trend of lower global atmospheric CO2 concentrations in spring and summer and higher concentrations in fall and winter (in the Northern Hemisphere) (Figure 3). The reason behind this drastic seasonal difference is due to terrestrial carbon sequestration, the capture and storage of carbon by plants on land, and the subsequent release of carbon as leaves fall and decompose in fall and winter. Terrestrial habitats like forests, wetlands, and prairies sequester carbon out of the atmosphere every day. Carbon is stored in the soil as plant matter decomposes. When it comes to inexpensive, minimal effort answers to climate change, this is one way our planet has it covered. All people have to do is preserve our last remaining natural spaces and make sure they function properly.
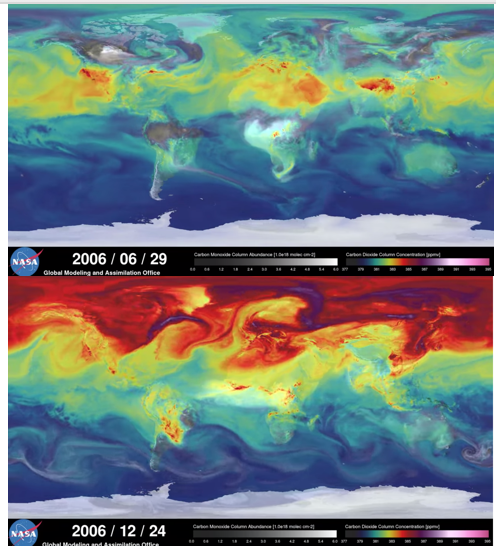
Figure 3: Summer (top) and Winter
What sets soil carbon storage apart from plant carbon storage is that soil carbon fluctuates less than plant carbon. However, much less is known about soil carbon content, which was a main motivation for my study. To better understand how much carbon sequestration potential certain ecosystems hold, I turned towards our charismatic megaflora: the redwood.
The Coast Redwood (Sequoia sempervirens) is an especially long-lived tree and the tallest tree on Earth. Some trees are reported to be about 2,000 years old. For my senior thesis, I investigated the soil carbon content of sites throughout the Coast Redwood range, including total carbon content, and water use efficiency (the amount of carbon that can be taken up for a given unit of water). As redwood leaves and branches, understory plants, roots, and animal matter decompose, they eventually become part of the soil, giving us an opportunity to measure the carbon content of not just redwoods, but the whole redwood forest habitat. I also wanted to see if this carbon content changed across the range of redwoods, from Big Sur to the border of Oregon. Coast Redwoods only occur at about 36°N to 42°N. Researchers understand that redwoods are dependent on summertime fog to relieve them from drought-induced stress. At their southern habitat limit, at about 36°N they gradually stop occurring, except in cool canyons along the coast. The same phenomenon happens at about 42°N. So I examined how abiotic factors, including latitude, elevation, rainfall, temperature, and fog influence carbon content and water use efficiency.
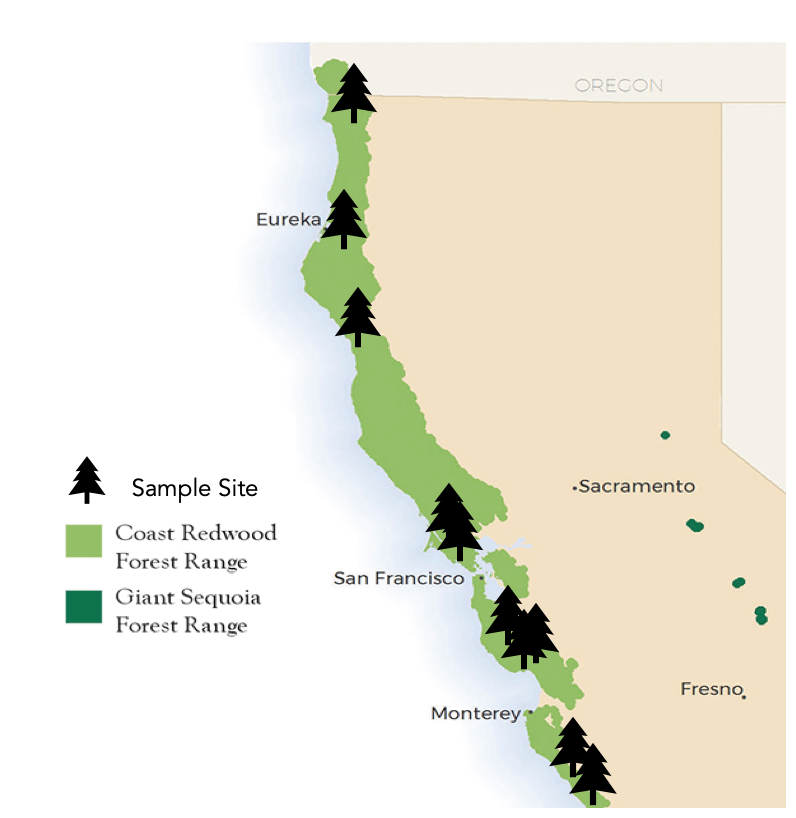
Figure 4: Redwood range and
sampling sites for this project.
My journey began in November 2018 when I was participating in the highly regarded UC-wide field course California Ecology & Conservation. In late November 2018, I began applying for research permits from the California State Parks Department, in order to collect data and sample soils throughout coastal California. Two months later, I set off to learn more about the redwoods millions of people come to visit every year. I visited 10 sites total: Limekiln State Park (SP), Big Creek Natural Reserve, UCSC Campus Natural Reserve, two Sempervirens Fund properties in the Santa Cruz Mountains, Samuel P. Taylor SP, Mt. Tamalpais SP, Navarro River SP, Humboldt Redwoods SP, and Jedediah Smith Redwood SP (Figure 4). Once there, I collected 12 soil samples at depths of 15-30 cm, after removing the duff layer (dead plant layer on the ground), and I measured the diameter of the tree trunk “at breast height” (DBH) and measured canopy cover of nearby trees. My field methods included: recording coordinates, removing duff layer, digging a 15-30 cm deep hole, collecting a trowel size soil sample, measuring DBH, and logging canopy cover (Figure 5). I collected 12 samples at each site resulting in 120 samples.
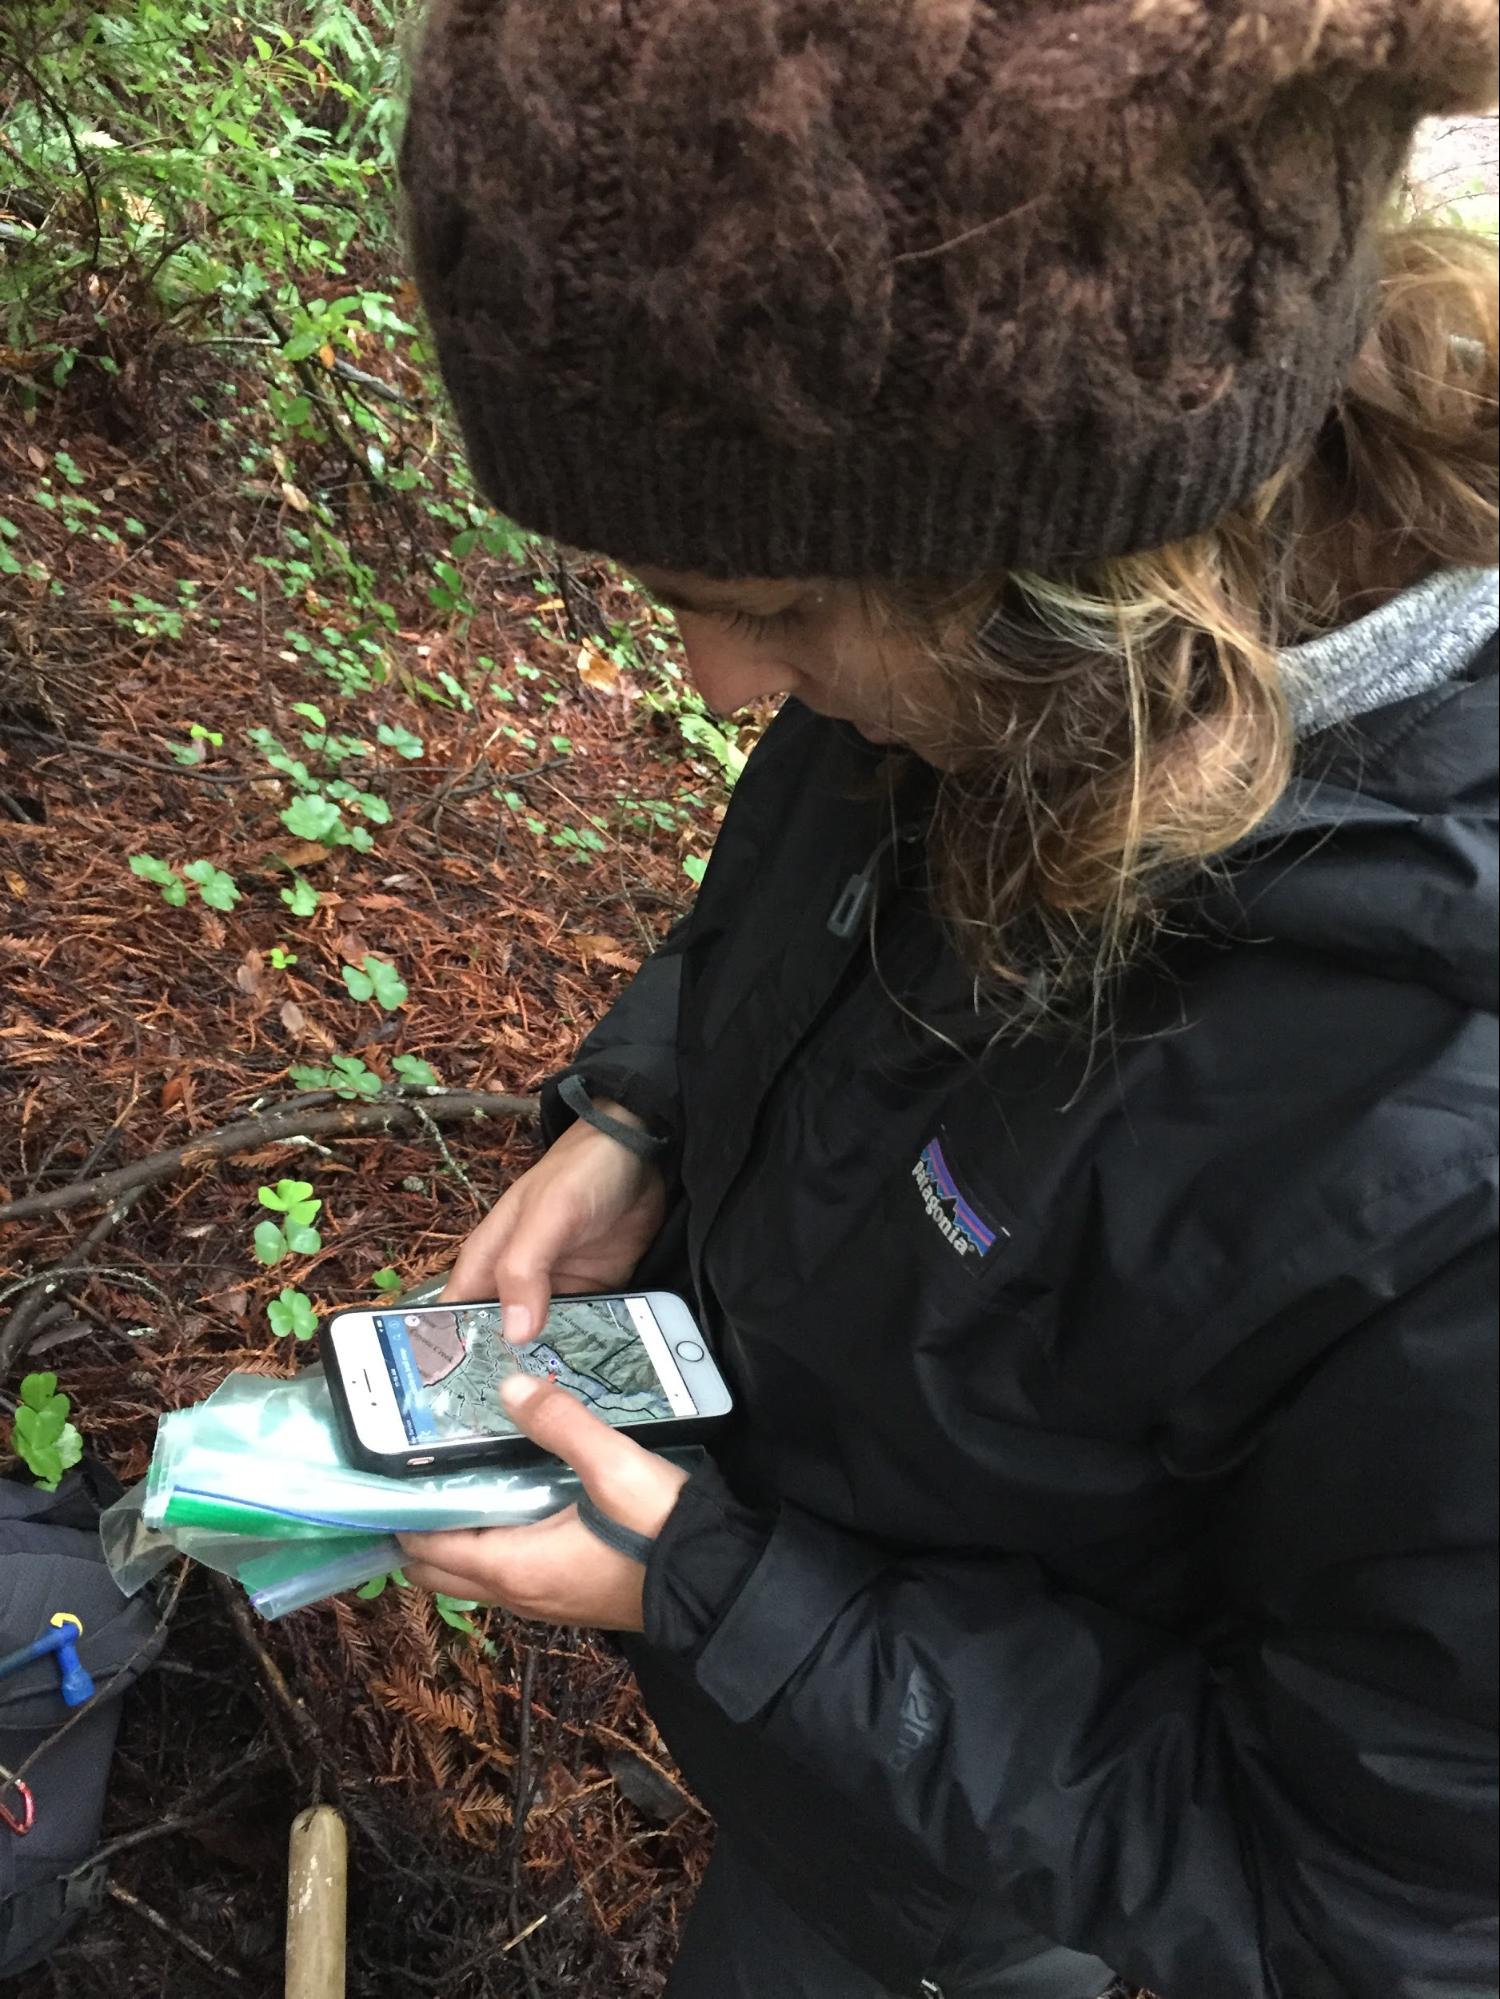
Figure 5: Lilianne using Avenza
Maps to mark a site.
Back in the lab, I measured soil water content, soil organic matter content, as a proxy for organic carbon content, and sent a subset of my samples to the UCSC Stable Isotope Laboratory to obtain measurements of total carbon content and water use efficiency (Figure 6). To my surprise, the results were the opposite of my original hypothesis. Going into this project, I thought that soil carbon content would increase in the northern latitude forests, where there is more rainfall and lower temperatures on average. However, soil carbon content decreased along a south to north gradient. It is possible that organic material may run off more easily in northern areas with more average precipitation. With higher average precipitation, and subsequent flooding, organic matter, and thus potential soil carbon, may get washed away more easily than in the drier southern parts of the range.
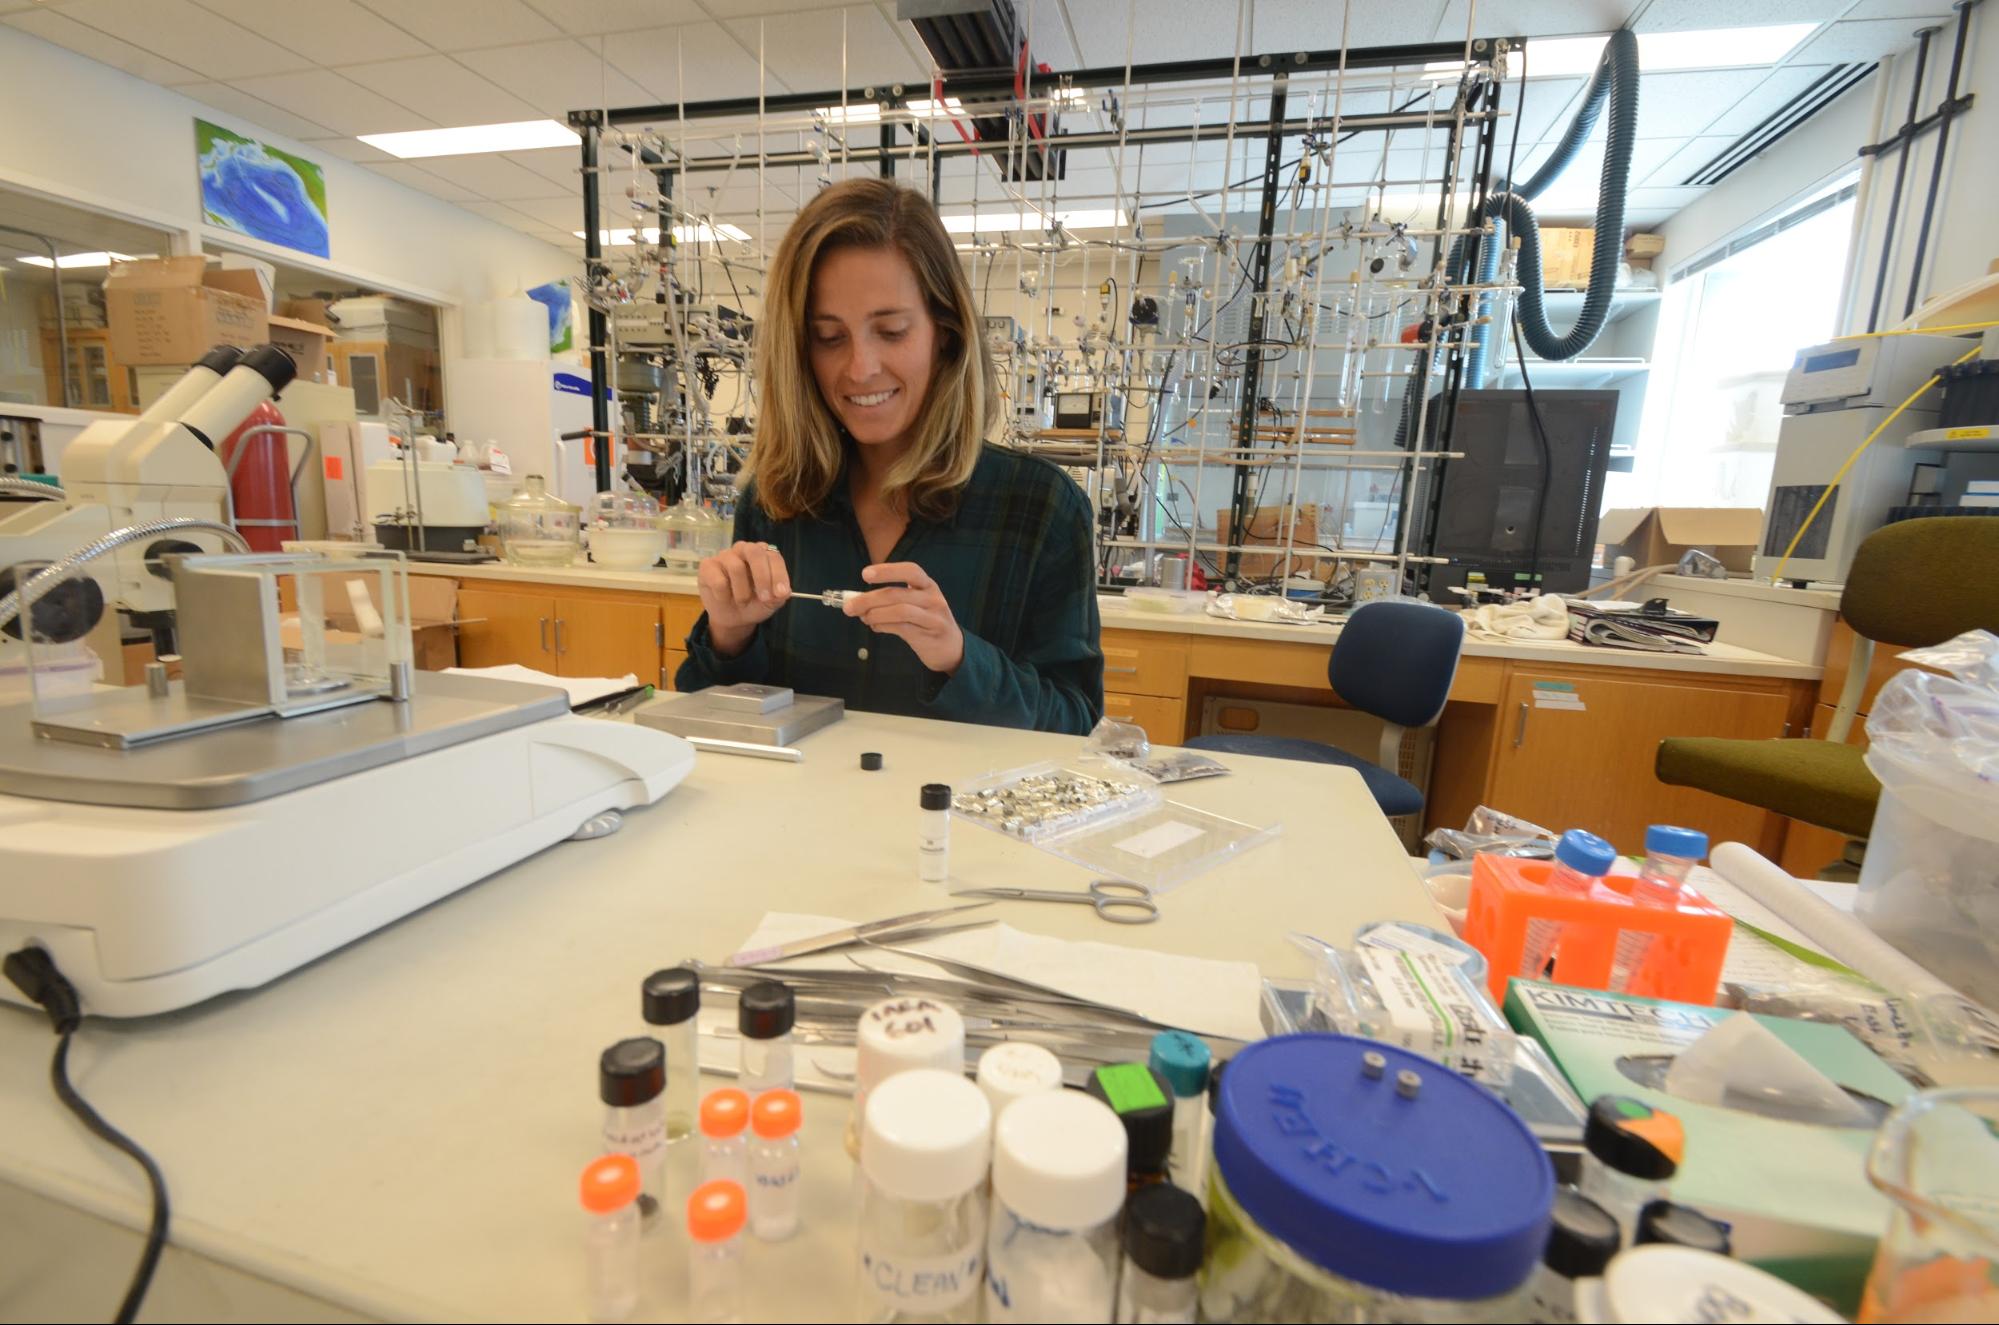
Figure 6: Lilianne prepping samples for isotope
analysis.
It is crucial for scientists to properly explain their process and findings to involve and engage the public in the process of science. That’s why I’ve emphasized communicating my research experience to the public, in a digestible way. I did this by using social media platforms like Instagram and Facebook, and creating a National Geographic Open Explorer page where I posted my field experience and lab processes. I was the only undergraduate to attend the annual UCSC Climate Conference at the Rio Theater in April 2019 (Figure 7). I am also reaching out to University relations to work on podcasts and articles about undergraduate research opportunities.
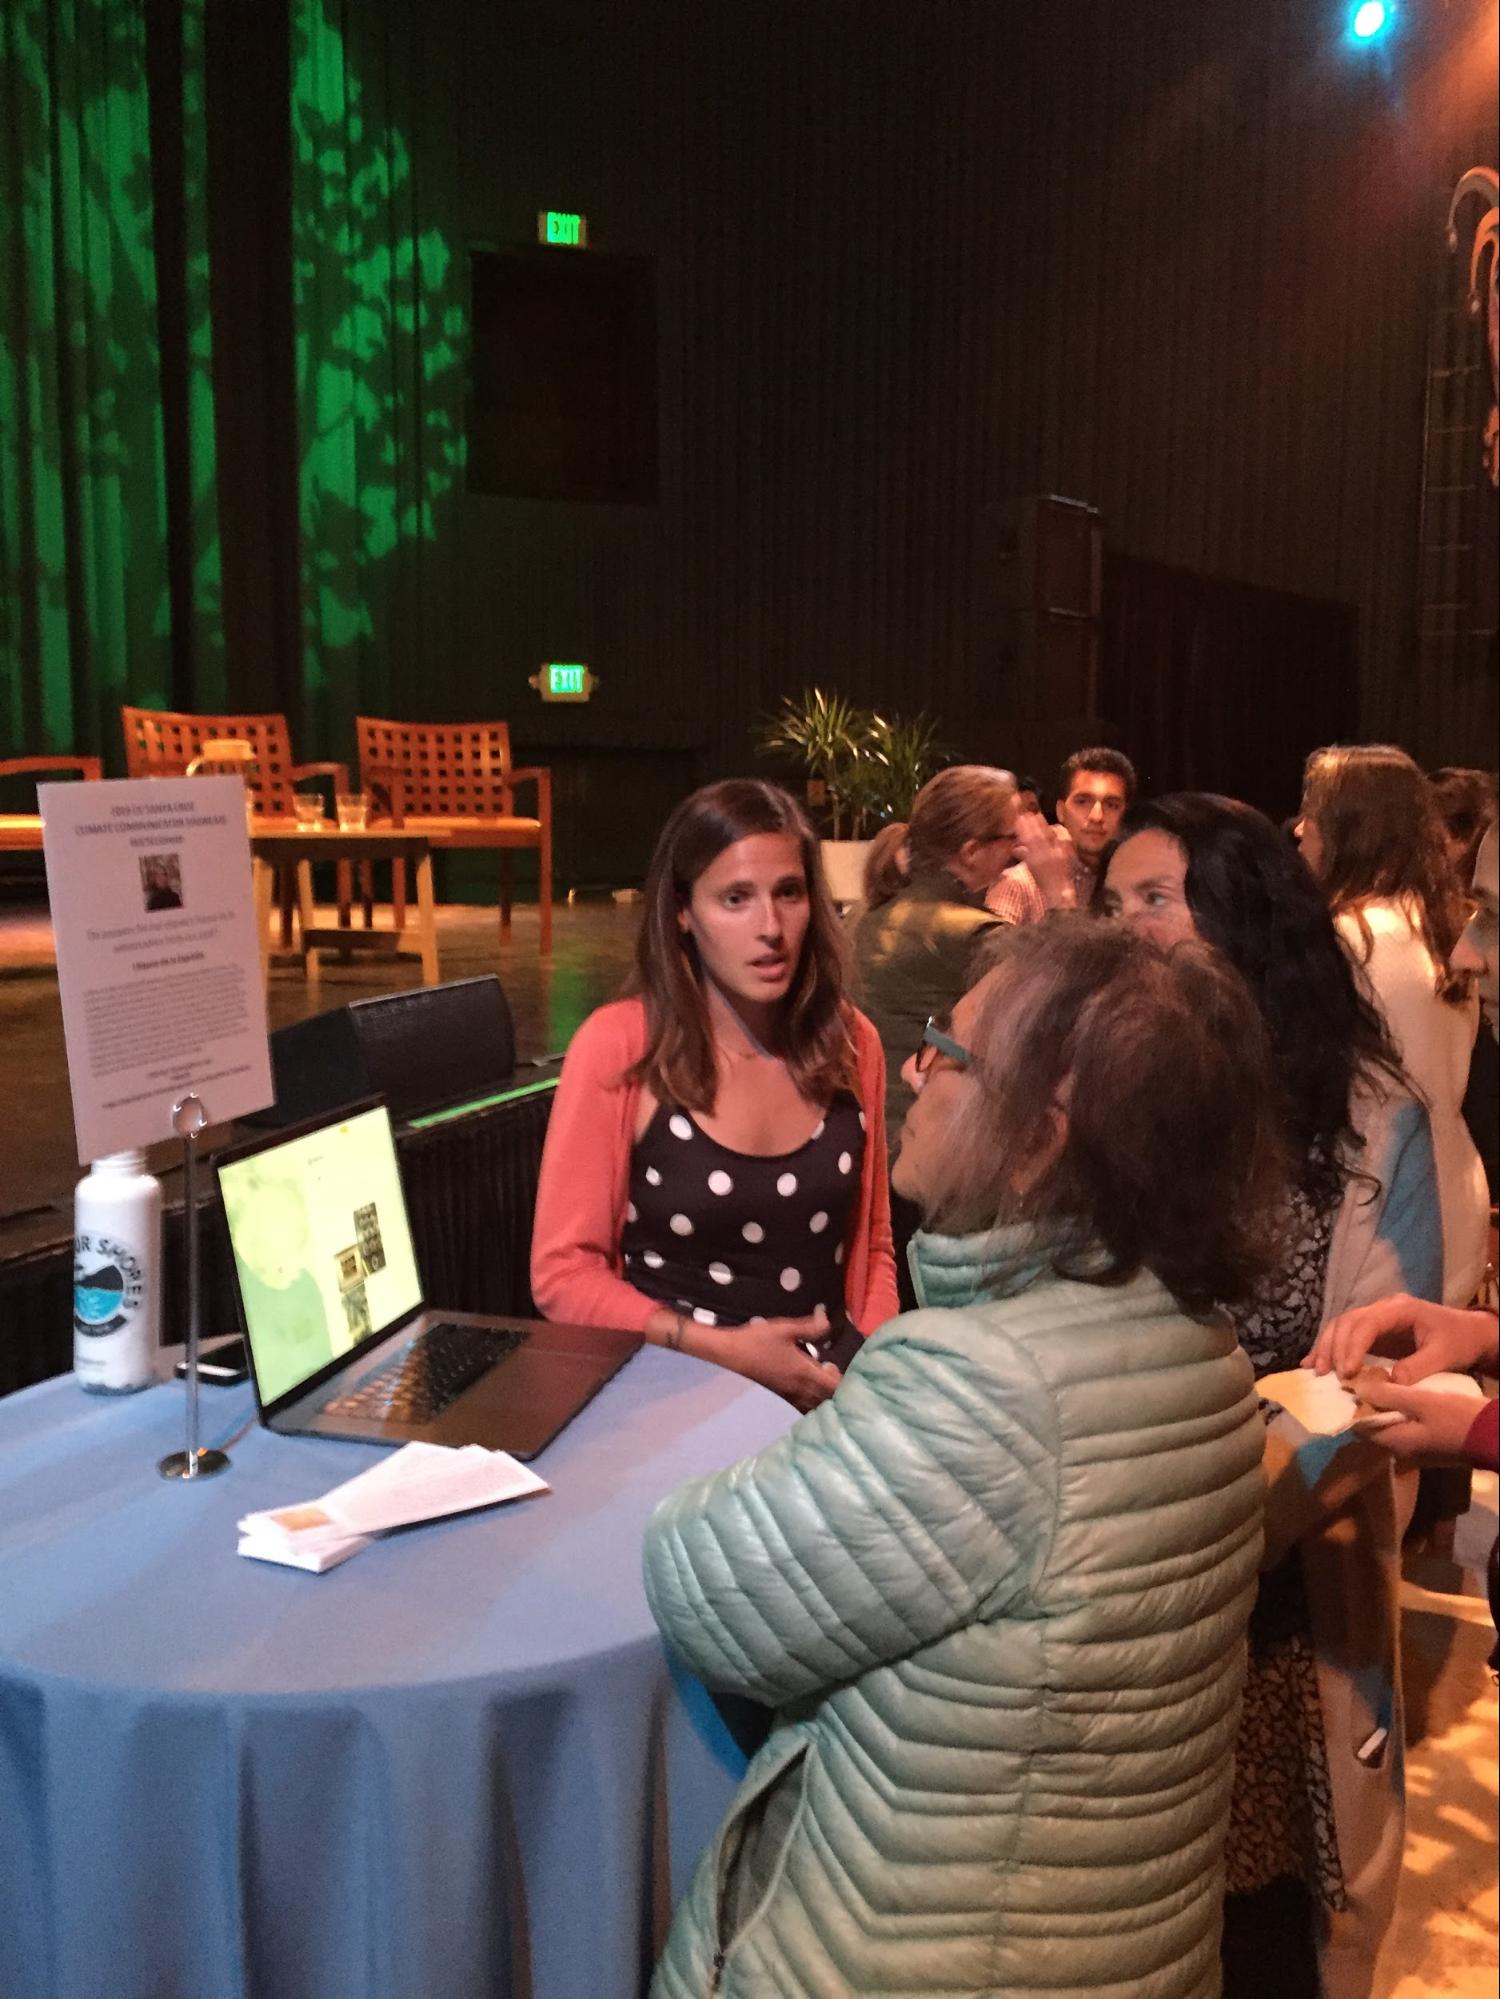
Figure 7: Lilianne speaking to
concerned citizens at the
UCSC Climate Conference.
This experience has been irreplaceable and I am honored to stand on the shoulders of those who carefully crafted the amazing Environmental Studies program. I hope that my research experience as an undergraduate inspires others to study what interests them the most.
Funding from the Griswold Endowed Chair enabled me to to conduct this project. Thank you to the Sempervirens Fund for the honor of studying your beautiful properties;to my advisor Prof. Loik for your unwavering enthusiasm; to Alex Jones and Mark Readdie for allowing me to sample on the Campus Reserve and Big Creek Reserve; to Michael Wilshire for your assistance wherever it was needed; to Kelsey Forbush and Prof. Cheng for teaching me how to work with soil, and graciously welcoming me into your lab; and to Colin Carney at the Stable Isotope Facility for guiding me through the isotope analysis portion of my study. Also a huge thank you to Timothy Miller and Krikor Andonian, the field course, California Ecology & Conservation you two carefully facilitate is one of the most robust learning experiences I’ve had in my life.
